Collapse in Demand for Flats Raises Question Mark Over Ealing's New Cinema
Only one new build sold in area this year and that went for highest ever price
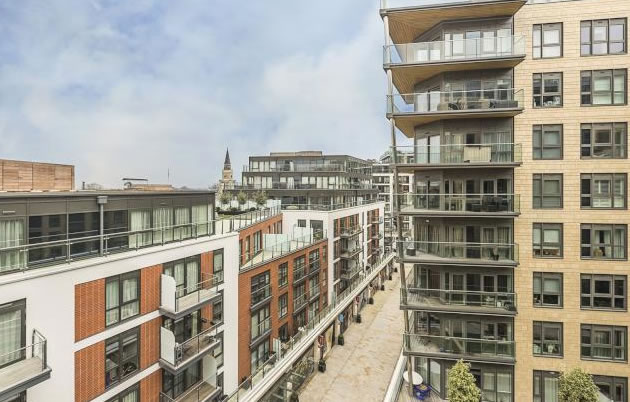
Most expensive flat ever in Ealing sold recently in Vista House
Assurances that Ealing’s long delayed cinema opening will not be delayed again could be undermined by a collapse in demand for new build flats.
The Filmworks project on the Broadway is to incorporate 200 new flats which developer St George, a member of the Berkeley Group, is hoping to sell at prices ranging from around £550,000 to over a million. They started marketing the flats a few weeks ago. Along with a new shopping centre these were to fund the preservation of the art deco façade of the Empire Cinema and the building of a new eight screen Picturehouse Cinema.
However, newly released figures from the Land Registry have shown that buyer interest in newly built flats in the area seems to have completely evaporated. Just one sale of this property type has been reported in the W5 post code area so far this year and that is of a unit in Vista House in Dicken’s Yard which went for £3,000,000 the highest price ever paid for a flat in the area. This is believed to be one of the premium units offering views across London.
Local agents say that a combination of stamp duty changes and new tax and regulations have discouraged buy-to-let investors who were the main source of interest for projects of this kind. Possible further increases in interest rates and uncertainty over Brexit negotiations are also believed to be reducing buyer interest.
A spokesperson for the developer St George said that they were 'very happy' with the level of inquiries since marketing of the Filmworks development and said the scheme had 'generated lots of interest.' It was pointed out that the Dicken's Yard development had a large number of units and they were now almost completely sold out. On the issue of the completion of the cinema they said that an opening date in 2020 was stlll 'very much the ambition'.
We have also asked the Council for comment on the ongoing viability of the Filmworks project. Previously they have insisted that there will be no further delays to the scheme but it is not clear that St. George have any contractual obligation to complete the scheme within the Council’s desired timeframe.
Turnover has also reduced in the secondary market in Ealing with just 80 sales reported in W5 in the first quarter and 48 in Ealing. Prices remain around historic highs with the average price in W5 £738,194 up by 5.4% over the year. However this rise is mainly driven by an increased proportion of houses to flats being sold. In West Ealing, W13, prices have fallen by 7.3% over the last year to an average of £682,201.
One area were demand seems to be relatively robust is for large family houses. A house on Mount Park Crescent recently changed hands for £2,100,000 and a detached property in North Avenue sold for £2,150,000.

According to the Nationwide House Price Index, property values in London as a whole fell by 1% in March compared with the same month last year. For the UK overall prices are up by 2.1% and the gap between the capital and the rest of the country has been slowly reduced over the last few months.
Commenting on the figures, Robert Gardner, Nationwide's Chief Economist, said: “Looking ahead, much will depend on how broader economic conditions evolve, especially in the labour market,
but also with respect to interest rates. Subdued economic activity and the ongoing squeeze on household budgets is likely to continue to exert a modest drag on housing market activity and house price growth this year."
Home ownership rates have declined across all English regions over the past decade. While the decline has been fairly uniform across regions, the biggest reduction has been in London, where the home ownership rate has fallen from 57% to 47%. The counterpart to this has been robust growth in the private rental sector; for example, 30% of households in London now rent.
The RICs say that their surveyor members report on balance an expectation of no price rises over the next 12 months representing the joint lowest reading since February 2013. Regionally, there continues to be significant variation in the house price indicator. London, exhibits the weakest feedback, with a net balance of -47% of respondents citing further price declines.
| Ealing W5 Post Code Area Property Prices - (January - March 2018) | ||||||||||
|---|---|---|---|---|---|---|---|---|---|---|
Area |
Detached |
Sales |
Semi-detached |
Sales |
Terraced |
Sales |
Flat/ |
Sales |
Overall Ave |
Overall Sales |
| W5 1 | 0 | 0 | 829590 | 5 | 902400 | 5 | 518200 | 5 | 750063 | 15 |
| W5 2 | 2100000 | 1 | 0 | 0 | 900000 | 2 | 729260 | 10 | 860969 | 13 |
| W5 3 | 1478333 | 3 | 1381250 | 2 | 897500 | 2 | 435312 | 8 | 831667 | 15 |
| W5 4 | 785000 | 1 | 761857 | 7 | 711500 | 12 | 456996 | 13 | 624150 | 33 |
| W5 5 | 1400000 | 1 | 0 | 0 | 1120000 | 1 | 510000 | 2 | 885000 | 4 |
| Total | 1453333 | 6 | 874532 | 14 | 807500 | 22 | 534922 | 38 | 738194 | 80 |
| Change in Quarter | -2.7% | -14.3% | 7.2% | 133.3% | 5.5% | 0.0% | -19.2% | -44.9% | -1.4% | -23.1% |
| Change in year | -12.4% | 0.0% | -17.3% | 75.0% | -3.7% | -12.0% | 5.0% | -39.7% | 5.4% | -21.6% |
| Change in three years | -37.6% | -33.3% | -12.8% | 55.6% | -2.6% | -21.4% | 7.2% | -39.7% | -5.0% | -26.6% |
| Change in five years | -0.4% | -40.0% | 12.2% | 40.0% | 32.2% | -38.9% | 50.1% | -63.8% | 45.3% | -50.3% |
| Change in ten years | 52.7% | 100.0% | 46.2% | -30.0% | 77.3% | -8.3% | 63.9% | -48.6% | 79.0% | -33.9% |
| Ealing W13 Post Code Area Property Prices - (January - March 2018) | ||||||||||
|---|---|---|---|---|---|---|---|---|---|---|
Area |
Detached |
Sales |
Semi-detached |
Sales |
Terraced |
Sales |
Flat/ |
Sales |
Overall Ave |
Overall Sales |
| W13 0 | 0 | 0 | 795000 | 3 | 658357 | 7 | 349542 | 6 | 568172 | 16 |
| W13 8 | 2150000 | 1 | 1201667 | 3 | 720000 | 1 | 383744 | 8 | 734227 | 13 |
| W13 9 | 1630000 | 1 | 1247500 | 2 | 747845 | 10 | 417750 | 6 | 742629 | 19 |
| Total | 1890000 | 2 | 1060625 | 8 | 711497 | 18 | 383685 | 20 | 682201 | 48 |
| Change in Quarter | 30.8% | -33.3% | -2.1% | -46.7% | -3.2% | -30.8% | -14.5% | -33.3% | -5.0% | -35.1% |
| Change in year | 40.7% | -33.3% | -4.3% | -33.3% | -8.0% | -40.0% | -21.6% | -33.3% | -7.3% | -36.0% |
| Change in Three Years | -3.7% | -50.0% | 37.7% | 14.3% | 3.8% | -14.3% | -6.3% | -48.7% | 11.1% | -32.4% |
| Change in Five Years | - | - | 40.7% | -52.9% | 45.1% | 0.0% | 39.0% | -31.0% | 47.2% | -25.0% |
| Change in Ten Years | - | - | 68.7% | -46.7% | 60.0% | -50.0% | 34.9% | -64.3% | 76.5% | -55.1% |
Source: Land Registry
May 10, 2018