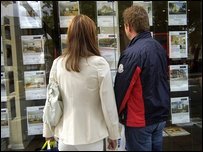
Tough Times for Hammersmith Estate Agents
Number of transactions falls dramatically
Local estate agents are facing some of the toughest times in living memory as the number of homes changing hands falls dramatically.
According to figures provided by the Land Registry there are only half as many transactions taking place in the W6 area compared to last year
New data from the Land Registry shows that the average property in the area fell in price by 7.8% in the latest quarter. Over the last year this has resulted in a marginal 1.3% rise in prices and over three years prices are by by 7.9% a worse return than putting your money in the building society.
The news on sales is even worse with only 77 properties in the are changing hands half the level of the same period last year. The top end of the market seems particularly moribund with few transactions taking place in that sector.
There appears to be an increasing desperation in the local estate agency business with many local residents reporting a deluge of 'free valuation' leaflets being sent out by agents to try to drum up business.
There is increasing speculation that the next few months could see a shake out of the industry with some established players leaving the market.
Although the fall in volumes is typical of many other areas of London, prices in this area have been unusually subdued. The volume of sales nationally is the lowest in 10 years since data was first collected.
We did try to get a local estate agent to comment on these figures but all those we approached did not respond to our request.
Property Prices in Hammersmith (Jan - Mar 2005)
The numbers below are subject to revision as is it usual that some properties are added late to the Land Registry's database.
| Detached | Semi-Detached | Terraced | Flat/Maisonette | Overall | |||||
| Region/Area | Sales | Sales | Av Price £ | Sales | Av Price £ | Sales | Av Price £ | Sales | |
|
0 |
0 |
448726 |
13 |
269845 |
10 |
370951 |
23 |
|
|
0 |
0 |
657875 |
4 |
203000 |
6 |
384950 |
10 |
|
|
0 |
0 |
447607 |
7 |
222762 |
16 |
291193 |
23 |
|
|
0 |
0 |
485277 |
9 |
264344 |
12 |
359029 |
21 |
|
| - | 0 | 483808 | 33 | 242108 | 44 | 345694 | 77 | ||
| Change in Quarter | - | - | -22.0% | -17.5% | -1.9% | -52.2% | -7.8% | -43.8% | |
| Change in year | - | - | -9.4% | -21.4% | -8.1% | -59.6% | 1.3% | -50.0% | |
| Change in 3 years | - | - | 4.3% | -36.5% | 15.7% | -37.1% | 7.9% | -39.8% | |
Source: Land Registry
May 29, 2005
Related links
|
