Hammersmith Property Prices Take a Springtime Dip
As the effect of flat sales in luxury developments appears to wear off
Hammersmith property prices appear to have taken a sharp did during the Spring with the headline average falling by over 20% in the second quarter of the year.
However, a closer analysis of the sales show that the level had previously been boosted by sales of flats in luxury riverside developments and with fewer of these coming to the market in recent months the average price in the W6 post code area has fallen from over a million to £808,498 in the second quarter of the year.
As with the previous rises, this fall was mainly driven by the price of flats, which saw a precipitous drop of 31.7% - of almost £300,000 - from £899,848 to £614,158.
Flat prices dropped across all four Hammersmith post code sectors, but the fall was most noticeable in the riverside area of W6 9, where the average price in this quarter of £614,158 was less than half of the £1,409,660 achieved in the previous three months.
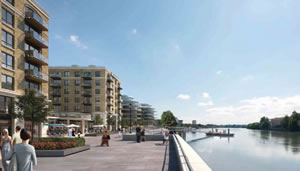
The simple explanation for this fall is a slowdown in sales at the huge luxury development Fulham Reach, as current phases start to sell out. Right now for example, the development has just eight properties available, priced from £818,950 for one bedroom.
Outside these developments, flats in traditional properties have a much more reasonable price tag - for example a two bedroom flat in nearby Queen Caroline Street is currently for sale for £415,000 and a one bedroom flat on the Crabtree Estate with balcony overlooking the river is available for £425,000.
Terraced houses also showed an overall average drop of 6.4% from £1,338,212 to £1,252,249 but again this does not tell the full story with prices rising in some parts of Hammersmith and falling elsewhere in the area.
And despite this mixed picture, the statistic show that in the longer term, the trend is upward. In the last five years, the overall average has climbed by 47.4%, semi-detached houses are up by 35%, terraced houses by 46.7% and despite this quarter's drop, flat price have risen by 77.5%.

June data from the Land Registry showed that the average house price in London increased by 9.2% over the same period in 2014. This brings the average to £481,820. For England and Wales as a whole the average price rose by 5.4% to an new all-time high of £181,619. The previous record was in November 2007 before the financial crisis.
The number of completed house sales in England & Wales during April 2015 decreased by 19% to 57,180 compared with 70,244 in April 2014 and the number of properties sold in England and Wales for over £1 million decreased by 22%to 874 from 1,114 a year earlier. There were only 41 repossessions in London in April - half of the level seen a year ago.
The latest RICS UK Residential Market Survey shows that house prices continue to be squeezed higher by growing demand and contracting supply in London. While 40% more chartered surveyors saw prices rise in London in July, supply to the market continued to decline with 16% more respondents reporting a fall in new instructions. Additionally, the shortage of housing inventory worsened further in the capital during July, with the average number of properties for sale per surveyor in London slipping to the lowest figure since February 2014.
Near term expectations for prices also continue to reflect the imbalance between demand and supply with 48% of members expecting prices to continue to rise in London over the next three months. This is the highest level since March 2014. However, rising prices have not dampened interest as new buyer enquiries rose for the fourth month in succession, with 36% of respondents reporting a rise in demand in the capital. Despite this steady and sustained improvement in demand, newly agreed sales continued to decline in London. Going forward, there is more optimism regarding the prospects for activity with 37% more respondents expecting sales to gain momentum over the next three months.
Simon Rubinsohn, RICS Chief Economist, said, “A renewed acceleration in house price inflation allied to a fairly flat trend in sales activity highlights the very real challenges being presented by the housing market. More worrying still is the suspicion that the imbalance between supply and demand will lead to even strong price gains over the next twelve months. This is also visible in the firmer pattern in the buyer enquiries series which has now risen for four months in succession reflecting in part, a further modest easing in credit conditions. This trend could be brought to a halt when base rates do eventually begin to rise but the dovish tone to the latest Bank of England Inflation Report suggests the first move will come a little later than previously thought likely and that subsequent increases will be very gradual indeed.’’
A detailed listing of properties sold recently in the area will be appearing in a forthcoming edition of the Hammersmith newsletter.
| Hammersmith Property Prices (April - June 2015) | ||||||||||
|---|---|---|---|---|---|---|---|---|---|---|
Area |
Detached |
Sales |
Semi- |
Sales |
Terrace |
Sales |
Flat/ |
Sales |
Overall Ave |
Overall Sales |
| W6 0 | 1100000 | 1 | 1350000 | 1 | 1490112 | 13 | 489236 | 25 | 851309 | 40 |
| W6 7 | 0 | 0 | 0 | 0 | 1955000 | 2 | 362200 | 10 | 627667 | 12 |
| W6 8 | 1212500 | 1 | 0 | 0 | 934700 | 10 | 498889 | 9 | 752475 | 20 |
| W6 9 | 0 | 0 | 0 | 0 | 1105333 | 9 | 781159 | 40 | 840701 | 49 |
| Total | 1156250 | 2 | 1350000 | 1 | 1252249 | 34 | 614158 | 84 | 808498 | 121 |
| Last quarter | - | - | - | - | -6.4% | 17.2% | -31.7% | -1.2% | -20.1% | 6.1% |
| Last year | -13.7% | -33.3% | -22.7% | -66.7% | -3.5% | -10.5% | 10.1% | -15.2% | 1.6% | -15.4% |
| Last three years | - | - | - | - | 25.0% | -15.0% | 66.7% | 50.0% | 27.9% | 26.0% |
| Last five years | - | - | 35.0% | -66.7% | 46.7% | -15.0% | 77.5% | 25.4% | 47.4% | 10.0% |
| Hammersmith Property Prices (January - March 2015) | ||||||
|---|---|---|---|---|---|---|
Area |
Terrace |
Sales |
Flat/ |
Sales |
Overall Ave |
Overall Sales |
| W6 0 | 1368893 | 11 | 532584 | 36 | 728316 | 47 |
| W6 7 | 1554000 | 5 | 553595 | 10 | 887063 | 15 |
| W6 8 | 1082143 | 7 | 610000 | 4 | 910455 | 11 |
| W6 9 | 1400888 | 6 | 1409660 | 35 | 1408377 | 41 |
| Total | 1338212 | 29 | 899848 | 85 | 1011362 | 114 |
| Last quarter | -1.3% | -12.1% | 10.6% | -18.3% | 3.2% | -19.7% |
| Last year | 2.0% | 7.4% | 101.4% | 10.4% | 39.0% | 6.5% |
| Last three years | 27.1% | 20.8% | 158.0% | 39.3% | 80.8% | 29.5% |
| Last five years | 49.7% | -34.1% | 170.5% | 80.9% | 67.4% | 25.3% |
| Last ten years | 176.6% | -12.1% | 271.7% | 93.2% | 192.6% | 48.1% |
Source: Land Registry
September 4, 2015
Related links
|