Average Property Price in Hammersmith Now Close to One Million
With flats in upmarket developments driving prices up to all time high
The average property price in Hammersmith soared in the last three months of 2014 to reach an all time high figure of £979,972.
This is up 19% on the previous quarter, when the average was £823,308.
This rise comes despite the slowdown in sales during this traditionally quiet period leading up to Christmas, from 201 in the previous quarter to 142. In common with neighbouring areas in West London, there was also a marked lack of activity at the very top of the market, with just four semi-detached home and one detached changing hands.
The number of terraced houses fell from 48 between July and September to 33, but prices still eased up by a small 1.6% to reach an average of £1,355,549.
However, as in the previous quarter, the price of flats in W6 continues to surge ahead. Although the volume of sales was also lower, down from 147 to 104 the average price leapt by an astonishing 36%, from £598,107 to £813,660.
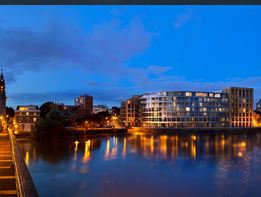
The largest rises were in the W6 0 area, which includes the town centre and the area around Ravenscourt Park, where the average jumped by over £100,000 to hit £642,986 and W6 9, which covers the entire stretch of Hammersmith's riverside, where the average flat now costs over one million pounds - £1,033,999.
The reason for these high prices is that these areas house a number of upmarket developments, including Fulham Reach and Queen's Wharf on Hammersmith's Riverside, Sovereign Court in the centre of town, St Peter's Place off King Street and Ashlar Court by Ravenscourt Park. At Queen's Wharf close to Hammersmith Bridge for instance, a studio flat costs £595,000 and one bed is priced £855,000.
In stark contrast, the price of older flats in the other two postcode areas, W6 7 and 8, fell slightly from £530,777 to £513,541 and from £522,150 to £500,695 respectively.
And while there is controversy over many of these properties being "ghost flats" sold to overseas buyers instead of local residents, this two tier market is set to continue with new phases to be released at existing developments and new launches planned by Linden Homes in King Street and on Goldhawk Road and Brackenbury Square off Goldhawk Road.

London continues to be the area of the country seeing the strongest price growth. During December the average price in the capital was £464,936 up another 1.8% compared to the previous month to bring the annual price rise to 16.8%
The December data shows a monthly price increase of 0.6 % bringing the annual price change to 7.0% and the average house price in England and Wales to £177,766.
The number of property transactions has increased over the last year. From July 2013 to October 2013 there was an average of 75,201 sales per month compared to 82,067 for the same period in 2014.
Simon Rubinsohn, RICS Chief Economist, said, 'Despite the slowdown, there is optimism that the stamp duty reforms will deliver a 2-5% boost in both sales and prices over the next 12 months, despite members in London expecting sales to decrease by between 5-10% and prices to decrease by 2-5%, with larger properties and/or those in prime areas expected to see the biggest price decreases.'
A detailed listing of properties sold recently in the area will be appearing in a forthcoming edition of the Hammersmith newsletter.
| Hammersmith Property Prices (October - December 2014) | ||||||||||
|---|---|---|---|---|---|---|---|---|---|---|
Area |
Detached |
Sales |
Semi- |
Sales |
Terrace |
Sales |
Flat/ |
Sales |
Overall Ave |
Overall Sales |
W6 0 |
500000 |
1 |
2753333 |
3 |
1255769 |
13 |
642986 |
25 |
979992 |
42 |
W6 7 |
0 |
0 |
0 |
0 |
2169600 |
5 |
513541 |
15 |
927556 |
20 |
W6 8 |
0 |
0 |
0 |
0 |
1141329 |
7 |
500695 |
10 |
764485 |
17 |
W6 9 |
0 |
0 |
1042500 |
1 |
1196313 |
8 |
1033999 |
54 |
1054745 |
63 |
Total |
500000 |
1 |
2325625 |
4 |
1355539 |
33 |
813660 |
104 |
979972 |
142 |
Last quarter |
22.0% |
-33.3% |
-1.6% |
-31.3% |
36.0% |
-29.3% |
19.0% |
-29.4% |
||
Last year |
-50.0% |
0.0% |
111.4% |
300.0% |
-15.6% |
230.0% |
75.6% |
352.2% |
19.1% |
305.7% |
Last three years |
123.2% |
-20.0% |
92.4% |
-17.5% |
116.8% |
10.6% |
98.4% |
2.2% |
||
Last five years |
58.8% |
17.9% |
163.4% |
89.1% |
98.9% |
71.1% |
||||
Last ten years |
203.6% |
-20.0% |
118.6% |
-17.5% |
229.7% |
13.0% |
161.5% |
3.6% |
||
Hammersmith Property Prices (July - September 2014) |
||||||||
|---|---|---|---|---|---|---|---|---|
Area |
Semi- |
Sales |
Terraced |
Sales |
Flat/ |
Sales |
Overall Ave |
Overall Sales |
| W6 0 | 1851135 | 5 | 1296667 | 18 | 535954 | 33 | 897896 | 56 |
| W6 7 | - | - | 2072000 | 5 | 530777 | 19 | 851865 | 24 |
| W6 8 | - | - | 1234700 | 10 | 522150 | 12 | 846036 | 22 |
| W6 9 | 2180000 | 1 | 1338703 | 15 | 649213 | 83 | 769143 | 99 |
| Total | 1905946 | 6 | 1377657 | 48 | 598107 | 147 | 823308 | 201 |
| Last quarter | 9.1% | 100.0% | 6.2% | 26.3% | 7.2% | 48.5% | 3.4% | 40.6% |
| Last year | 19.1% | 200.0% | 28.3% | -4.0% | 32.8% | 32.4% | 18.8% | 21.1% |
| Last three years | 37.6% | -14.3% | 59.2% | -2.0% | 72.8% | 93.4% | 38.6% | 52.3% |
| Last five years | - | - | 70.6% | 14.3% | 96.9% | 149.2% | 60.4% | 99.0% |
| Last ten years | 96.1% | 50.0% | 131.5% | -15.8% | 124.6% | 27.8% | 111.7% | 14.2% |
Source: Land Registry
February 20, 2015
Related links
|